
Continuous Process Monitoring: Key Metrics That Predict Drift Early


Continuous Process Monitoring: Key Metrics That Predict Drift Early
In high-stakes industrial environments, continuous process monitoring is more than a visibility tool—it is an early-warning system for drift, instability, and hidden performance loss. For technical evaluators, identifying the right leading metrics can mean faster root-cause detection, tighter control loops, and lower operational risk. This article examines the key indicators that reveal process drift before it escalates into quality, safety, or compliance failures.
The first mistake people make with continuous process monitoring is to treat it as a dashboard problem. It is not. A process can look stable on a screen and still be drifting toward an off-spec batch, an emissions excursion, a calibration failure, or a control upset. In practical terms, monitoring only becomes useful when it captures change early enough for operators, control engineers, or quality teams to intervene before the process crosses a hard limit. That distinction matters in chemical processing, power generation, water treatment, pharmaceutical manufacturing, and any line where measurement uncertainty, sensor lag, and process variability interact.
So the question is not whether the plant is collecting data. Most plants already are. The question is which metrics act as leading indicators of drift rather than just recording that drift has already happened. For technical evaluation work, that is where instrument selection, historian quality, sampling strategy, and alarm philosophy start to converge.
What “drift” really means in operating environments
Drift is often used too loosely. In one context it means sensor bias creeping over time. In another, it describes a gradual shift in the process itself: fouling in a heat exchanger, reagent concentration changing, valve stiction, membrane aging, catalyst deactivation, unstable feed composition, or a control loop that still works but no longer behaves the way it did after tuning. Those are not the same failure modes, and they do not announce themselves through the same variables.
That is why continuous process monitoring should not be reduced to checking whether a single PV remains inside its operating band. A reactor temperature can stay within target while the controller output keeps climbing to compensate for heat-transfer loss. A flow reading can appear flat while the differential pressure across a filter rises steadily. A pH system may remain compliant only because the dosing loop is working harder each shift. In each case, the process has already begun to move away from its normal condition, but the headline variable hides the change.
Good monitoring therefore looks for separation between the visible result and the effort required to maintain that result.
The metrics that usually reveal trouble first
There is no universal metric set that fits every plant, but several signal families repeatedly prove useful when the goal is early drift detection rather than retrospective reporting.
Control effort is one of the most overlooked indicators. When a process variable remains on target but the final control element is being driven closer to its limits, the loop is telling you that process conditions have changed. A steam control valve opening further every week to hold the same outlet temperature may point to fouling, poor insulation, condensate issues, or upstream supply variation. The measured temperature alone will not tell you that story.
Variance is another strong signal, but only if the source is understood. Rising variability in pressure, conductivity, dissolved oxygen, or flow can indicate real process instability; it can also indicate instrumentation problems such as signal noise, grounding issues, sample handling defects, or deteriorating analyzers. In regulated environments, particularly where continuous emission monitoring systems or online water analyzers are involved, that distinction matters because the compliance consequence of a bad reading is different from the consequence of a bad process.
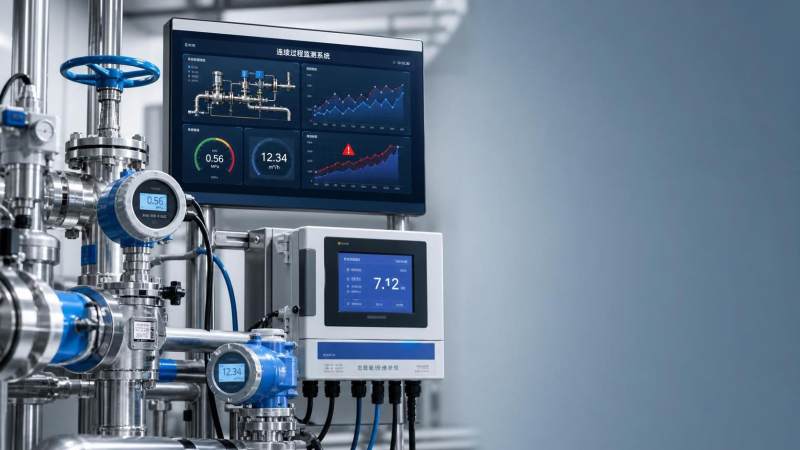
Trend slope matters because many losses appear gradually. A hard alarm on a final value often comes too late. Evaluators should look for metrics that express direction and speed: rising differential pressure across filters, increasing cycle time, creeping analyzer baseline offset, longer response time after step changes, or a steady rise in motor current for the same throughput. These are often more actionable than raw snapshots.
Why response time and dead time deserve more attention
Many monitoring systems focus on value accuracy and neglect timing quality. That is a gap. Drift frequently shows up first as a change in process response rather than a change in steady-state value. If a temperature loop takes longer to settle, if an analyzer’s sample transport delay grows, or if a level loop starts overshooting after routine disturbances, something has changed in the process path, the instrument chain, or the actuator behavior.
This is especially relevant in distributed control systems where multiple loops interact. Increased dead time can make an otherwise acceptable tuning strategy unstable. In batch operations it can distort phase transitions or endpoint detection. In life sciences and laboratory-linked production environments, timing drift may not violate a visible limit immediately, but it can still compromise repeatability, traceability, and method confidence.
For that reason, monitoring should include dynamic metrics where practical: settling time, overshoot frequency, actuator travel behavior, and delay between a disturbance and measured response. These are not always available out of the box, but they often separate mature monitoring programs from basic alarming setups.
A leading metric is only as credible as the measurement chain behind it
Technical teams sometimes discuss predictive metrics as if analytics can compensate for weak instrumentation. Usually they cannot. Continuous process monitoring depends on the integrity of the measurement chain: sensor selection, installation geometry, sample conditioning, calibration practice, signal transmission, time synchronization, and historian resolution. If those are weak, the “early warning” layer becomes a generator of false positives or, worse, false confidence.
In instrumentation-heavy sectors, this is not a theoretical point. Differential pressure measurements are sensitive to impulse line condition. Flow measurements can be distorted by insufficient straight-run piping or multiphase effects. Online analyzers may drift because of reagent issues, contamination, or environmental conditions rather than true process change. Laboratories working under ISO/IEC 17025 disciplines understand this instinctively: traceability and method control are part of measurement credibility, not paperwork added afterward. Industrial operations should apply the same logic when evaluating process-monitoring architecture.
Common misunderstandings that distort evaluation
One common misunderstanding is that more tags automatically mean better monitoring. In reality, excess data without process context often makes drift harder to identify. What matters is whether each metric has an interpretable relationship to a failure mechanism. If not, the system becomes crowded with signals that no one trusts or uses.
Another is the assumption that alarm thresholds are enough. They are necessary, but they are rarely sufficient for early prediction. Alarms are usually tied to process protection or compliance boundaries. Drift starts before those boundaries are reached. Monitoring therefore needs soft indicators: baseline deviation, control effort creep, pattern changes, and instrument cross-checks.
A third mistake is failing to separate process drift from instrument drift. If a conductivity analyzer drifts because of maintenance neglect, an operator may chase a non-existent water chemistry problem. If a pressure transmitter drifts low, a compressor system may appear healthier than it is. Technical evaluation should always ask: what independent evidence confirms the trend? Redundancy, lab correlation, manual checks, or mass-balance consistency are often more useful than adding another dashboard widget.
How to judge whether a monitoring approach is technically mature
A mature continuous process monitoring strategy is usually recognizable by a few traits. It links each watched metric to a known degradation mode. It distinguishes between operating-state changes and abnormal drift. It accounts for sensor health, not just process values. And it defines who is expected to act when a leading indicator moves, because unattended prediction has limited operational value.
For evaluators comparing systems, a useful set of questions is straightforward:
- Does the platform track control performance metrics, not only process values?
- Can it trend deviation from baseline and rate of change over meaningful time windows?
- How does it distinguish sensor failure, analyzer drift, and genuine process change?
- Are data timestamps, sampling intervals, and historian granularity sufficient for the process dynamics involved?
- Can it support regulated records, calibration workflows, or audit expectations where applicable?
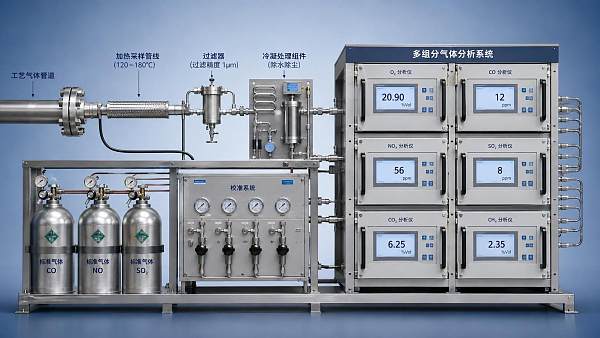
Those questions matter across sectors, whether the asset is a PLC-controlled production line, a DCS-based refinery unit, an emissions monitoring train, or a high-purity lab-support system. The underlying logic is the same: early detection depends on signal quality, contextual interpretation, and a credible link between metric movement and physical reality.
The most useful view of continuous process monitoring is not that it “watches the process.” It watches the distance between normal behavior and emerging abnormality, using metrics that move before the final KPI fails. For technical evaluators, that is the real standard. Not how many screens the system has, but whether it reveals drift while there is still time to do something intelligent about it.
Recommended for You
 When does process gas monitoring need continuous measurement?Process gas monitoring needs continuous measurement when rapid changes threaten safety, quality, compliance, or uptime. Learn how to specify reliable, actionable monitoring systems.
 How to prevent false alarms in power plant instrumentationPower plant instrumentation guide: prevent false alarms with reliable signal checks, smarter alarm settings, mode-based control, and actionable operator responses.
 How fixed gas detectors help prevent leaks in enclosed workspacesFixed gas detectors provide continuous leak monitoring in enclosed workspaces, enabling faster alarms, safer responses, and stronger protection for people and processes.
 How industrial gas analysis helps detect process contamination earlyIndustrial Gas Analysis helps detect oxygen, moisture, and hydrocarbon contamination early, enabling faster fault isolation, safer operations, and stronger process control.
 What drives environmental compliance continuous monitoring setup cost?Environmental compliance continuous monitoring setup cost: uncover hidden expenses, compare bids accurately, and build a reliable, audit-ready system.
 How to select gas analysis equipment for continuous emissions monitoringGas analysis equipment selection guide for reliable continuous emissions monitoring—compare technologies, sampling, calibration, compliance, and maintenance needs.
 What detection limit is needed for NH3 environmental monitoring?High accuracy NH3 analyzer for environmental monitoring: learn how to set the right detection limit, improve sampling reliability, and make defensible decisions.
 How to select a NOX analyzer for power plant emissions complianceNOX analyzer for power plant emissions: learn how to select a compliant, reliable CEMS solution with the right range, sample handling, calibration, and data integrity.
 How to evaluate a laser gas analyzer manufacturer in GermanyLaser gas analyzer manufacturer in Germany: compare accuracy, sample handling, interference control, calibration, and service to select a reliable solution.
 How does a flue gas analyzer maintain accuracy in wet stack gas?Flue gas analyzer accuracy in wet stack gas depends on heated sampling, moisture correction, reliable sensors, and calibration. Explore key selection tips.
 What makes equipment suitable for a hazardous environment?Hazardous Environment equipment selection explained: certification, ignition control, materials, installation, and maintenance for safer operations.
 How Can Fugitive Emission Monitoring Results Be Validated?How to validate fugitive emission monitoring results: learn calibration, field documentation, data-quality checks, and compliance comparisons for credible, decision-ready reports.
 Do Stack Testing Instruments Need Heated Sample Lines?Do stack testing instruments need heated sample lines? Learn when heating protects sample integrity, prevents condensation, and improves reliable emissions measurements.
 What Are the Risks of Using Low-Cost Electrochemical Gas Analyzers?What are the risks of using low-cost electrochemical gas analyzers? Explore calibration drift, cross-sensitivity, safety, and compliance concerns before you buy.
 How Long Does It Take to Integrate a Custom Emission Monitoring Solution?How long does it take to integrate a custom emission monitoring solution? Explore timelines, site readiness, data integration, and validation factors.
 Is Industrial Safety Monitoring the Same as Emission Monitoring?is industrial safety monitoring the same as emission monitoring? Learn the key differences in purpose, alarms, compliance, and instrument selection for safer operations.
 What Monthly Maintenance Does a Wireless Measurement Node Need?What maintenance does a wireless measurement node need monthly? Explore practical checks for battery health, signal quality, sensor accuracy, enclosures, and reliable data.
 Can Measurement and Control Systems Handle Corrosive Flue Gas?Can measurement and control systems handle corrosive flue gas? Discover proven design strategies for reliable sensing, sampling, materials, and maintenance.
 How Can Data Logging Instruments Pass an Environmental Audit?Learn how to ensure data logging instruments pass environmental audit with proven calibration, data integrity, alarm control, and traceable compliance records.
 What Are the Common Pitfalls of Integrating Multiple Gas Analyzers?What are common pitfalls when integrating multiple gas analyzers? Discover how sampling, timing, calibration, and data integration risks affect reliable decisions.
 Is Predictive Analytics for Emission Control Useful or Just Hype?Is predictive analytics useful for emission control or just hype? Discover how reliable data, CEMS, and practical pilots can reduce risk and support compliance.
 How to select a hydrogen analyzer for petrochemical process safetyHydrogen analyzer for petrochemical industry selection guide: compare technologies, sample systems, response time, and safety certifications for reliable process protection.
 When does a thermal conductivity detector outperform an FID?Thermal conductivity detector vs. FID: discover when TCD is the smarter choice for permanent gases, bulk analysis, non-destructive detection, and reliable GC method design.
 What certification should you verify before buying an IECEx analyzer?IECEx analyzer buyers: verify the Certificate of Conformity, Ex marking, special conditions, and exact configuration before purchase. Avoid costly compliance risks.
 How oxygen analysis helps prevent incomplete combustionOxygen analysis helps prevent incomplete combustion by optimizing air-to-fuel balance, reducing fuel waste, improving burner safety, and supporting emissions control.
 How to size an industrial gas system for stable peak demandIndustrial gas system sizing guide for stable peak demand. Learn how to assess flow, pressure drop, buffer storage, purity, redundancy, and commissioning for reliable production.
 How to choose a process sensor for high-temperature applicationsProcess sensor selection for high-temperature applications: compare thermal limits, materials, accuracy, installation, and maintenance to secure reliable control data.
 When does continuous analysis improve industrial process control?Continuous analysis improves industrial process control with timely composition data that supports faster decisions, higher quality, safer operations, and less waste.
 How to choose emission control systems for variable industrial loadsEmission Control solutions for variable industrial loads: learn how to match technology, controls, monitoring, and lifecycle costs for reliable compliance.
 How continuous emissions monitoring supports reliable emission reductionEmission Reduction relies on reliable continuous emissions monitoring. Discover how accurate data, calibration, and process insights support compliance and smarter control.
 When does it make sense to automate a production line?Production Line automation makes sense when processes are stable, measurable, and repeatable. Learn the key signals, risks, and ROI triggers before you invest.
 What accuracy should a monitoring device deliver in power quality applicationsMonitoring Device accuracy in power quality applications affects compliance, troubleshooting, and decision confidence. Learn what specs, standards, and installation factors truly matter.




Search Categories
Search Categories
- Smart Meters & Power Quality
- Transformer Gas Analyzers
- BESS Thermal Runaway Detectors
- Energy, Power & Smart Grid Monitoring
- Optical Profilers & CMM
- Ultrasonic & X-Ray NDT
- Calibration Standards
- Precision Metrology & NDT
- Water Quality Analyzers
- CEMS & VOCs Monitors
- Price Trends
- Import & Export Updates
- Market Trends
- Industry News
- Industry Insights
Latest Article
- When does process gas monitoring need continuous measurement?Process gas monitoring needs continuous measurement when rapid changes threaten safety, quality, compliance, or uptime. Learn how to specify reliable, actionable monitoring systems.Posted by:
- How to prevent false alarms in power plant instrumentationPower plant instrumentation guide: prevent false alarms with reliable signal checks, smarter alarm settings, mode-based control, and actionable operator responses.Posted by:
- How fixed gas detectors help prevent leaks in enclosed workspacesFixed gas detectors provide continuous leak monitoring in enclosed workspaces, enabling faster alarms, safer responses, and stronger protection for people and processes.Posted by:
Please give us a message
